

Referral marketing success depends on tracking conversion, CLV, participation, viral growth, and CPRA. Combine behavioral, cohort, and attribution insights to optimize incentives, prove ROI, and scale a sustainable, customer-led acquisition engine for long-term profitable growth.
Referral marketing has exploded into one of the most powerful growth strategies available to modern businesses. With customers increasingly skeptical of traditional advertising, word-of-mouth recommendations from friends and family carry unprecedented weight. But here’s the challenge: how do you measure the success of your referral program beyond simple vanity metrics?
The answer lies in tracking the right referral marketing metrics—those that reveal genuine program performance and guide strategic decisions. This comprehensive guide explores the essential metrics that separate thriving referral programs from those that merely exist, helping you optimize your strategy for maximum impact and ROI.
Understanding the Referral Marketing Landscape
Referral marketing operates on a simple principle: happy customers become brand advocates who recommend your product or service to others. However, measuring its effectiveness requires a nuanced approach that goes beyond counting referrals.
Modern referral programs generate multiple touchpoints throughout the customer journey. From initial program awareness to successful conversions, each stage presents unique measurement opportunities. The key is identifying which metrics provide actionable insights versus those that simply look impressive in reports.
Core Referral Marketing Metrics You Must Track
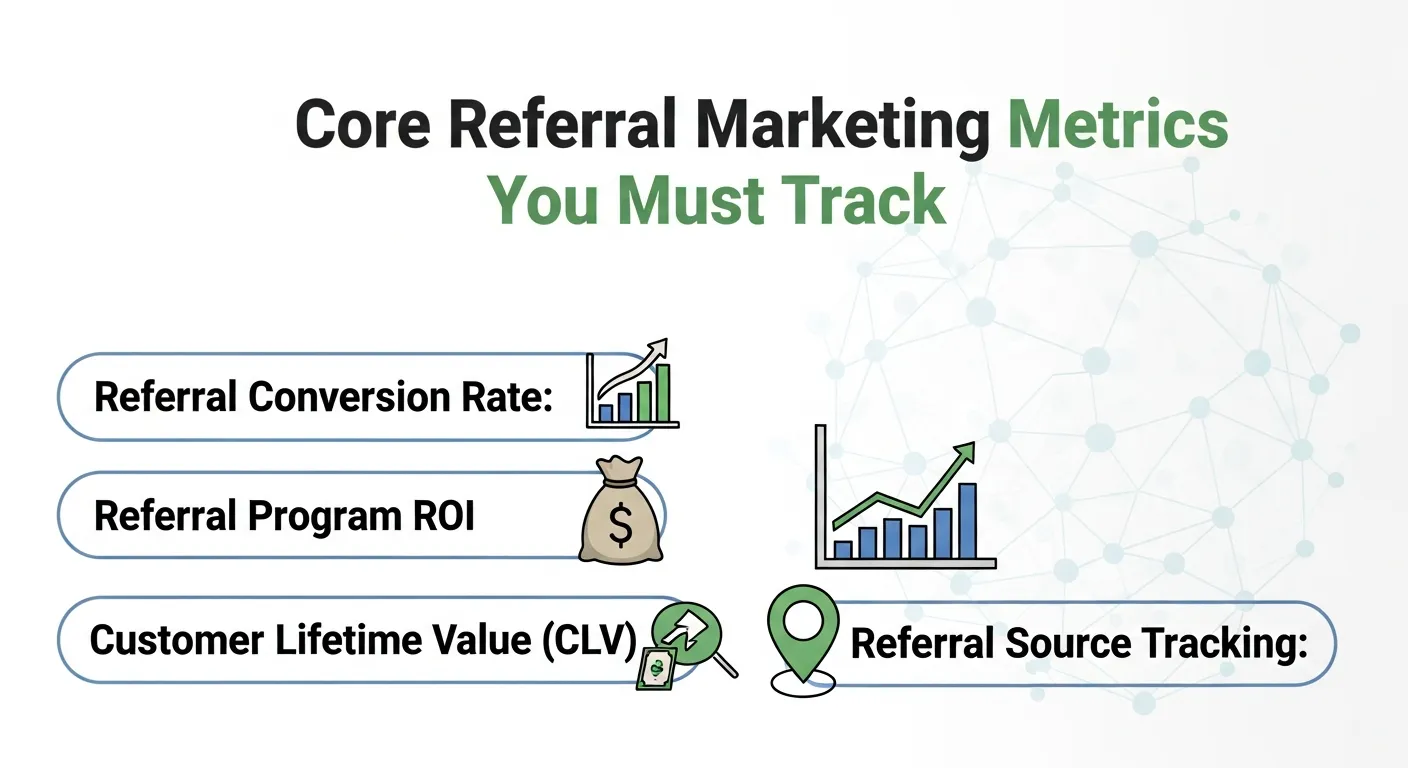
Referral Conversion Rate
Your referral conversion rate measures the percentage of referred prospects who complete a desired action—whether that’s making a purchase, signing up for a trial, or subscribing to your service. This metric serves as your program’s pulse check.
Calculate referral conversion rate by dividing successful referral conversions by total referral clicks, then multiplying by 100. A healthy referral conversion rate typically ranges from 3% to 15%, depending on your industry and offer complexity.
High conversion rates indicate strong product-market fit and effective referral targeting. Low rates might signal misaligned audiences or weak value propositions.
Customer Lifetime Value (CLV) of Referred Customers
Referred customers often demonstrate higher loyalty and spend more over time compared to customers acquired through other channels. Tracking the CLV of referred customers helps justify program investments and optimize reward structures.
Research consistently shows that referred customers have 16% higher lifetime value than non-referred customers. They also exhibit lower churn rates and make more frequent purchases.
To calculate CLV for referred customers, multiply the average purchase value by purchase frequency, then multiply by customer lifespan. Compare this figure against non-referred customers to quantify your program’s long-term impact.
Referral Program Participation Rate
Participation rate measures the percentage of your eligible customers who engage with your referral marketing. This metric reveals program awareness and appeal among your customer base.
Calculate the participation rate by dividing active referrers by total eligible customers, then multiplying by 100. Benchmark participation rates vary widely, but 5% to 15% represents solid performance for most industries.
Low participation rates often indicate poor program visibility, complicated sharing processes, or insufficient incentives. High rates suggest strong program appeal and effective promotion strategies.
Cost Per Referral Acquisition
Cost per referral acquisition (CPRA) measures how much you spend to acquire each new customer through referrals. This includes program setup costs, reward payments, technology expenses, and promotional investments.
CPRA typically runs 30% to 50% lower than traditional customer acquisition costs. Calculate CPRA by dividing total referral program costs by the number of customers acquired through referrals.
Monitoring CPRA helps optimize reward structures and identify cost-saving opportunities without compromising program effectiveness.
Common Mistakes in Measuring Referral Marketing Metrics
Even well-designed referral programs fail due to measurement mistakes. Understanding these pitfalls helps avoid misleading insights and wasted budget.
1. Focusing Only on Referral Volume
Many marketers celebrate high referral counts without analyzing conversion quality. High referral traffic with low conversion rates signals misaligned incentives or poor targeting.
2. Ignoring Long-Term Impact
Referral programs deliver compounding value, but many teams measure only short-term conversions. Without tracking CLV, retention, and repeat purchases, ROI appears underestimated.
3. Misattribution Across Channels
Referrals often assist conversions rather than directly closing them. Failing to use multi-touch attribution undervalues referral impact and leads to underinvestment.
4. Overlooking Fraud and Self-Referrals
Incentives can attract abuse. Track duplicate accounts, IP addresses, and suspicious reward redemption patterns to protect program integrity.
Referral Program KPIs for Executive Reporting
Executives care about business impact—not marketing dashboards. Translate referral metrics into strategic KPIs.
1. Referral Revenue Contribution
Measure how much total revenue comes from referrals versus other acquisition channels.
2. Referral ROI
ROI = (Referral Revenue − Referral Costs) / Referral Costs × 100
This metric justifies budget allocation and scaling decisions.
3. Referral Customer Retention Rate
Track retention differences between referred and non-referred customers to prove referral quality.
4. Advocacy Rate
Percentage of customers who actively promote your brand. This metric connects referral marketing to brand loyalty.
How to Build a Referral Marketing Analytics Dashboard
A centralized dashboard ensures real-time optimization and stakeholder alignment.
Essential Dashboard Metrics
- Referral traffic
- Referral conversion rate
- Participation rate
- Viral coefficient
- CPRA
- CLV of referred users
- Referral revenue share
Recommended Tools
- Google Analytics & GA4
- Referral platforms (ReferralCandy, Friendbuy, Yotpo)
- CRM systems (HubSpot, Salesforce)
- Data visualization tools (Looker, Tableau, Power BI)
Psychological Metrics: Measuring Referral Motivation
Beyond numbers, understanding why customers refer helps scale advocacy.
1. Net Promoter Score (NPS)
NPS predicts referral likelihood and program growth potential.
2. Emotional Loyalty Index
Track customer sentiment, brand attachment, and satisfaction scores.
3. Incentive Elasticity
Measure how referral behavior changes when rewards increase or decrease.
Referral Funnel Metrics
Track referral performance across the entire journey.
Referral Funnel Stages
- Program Awareness
- Referrer Activation
- Referral Link Click
- Referred Signup
- Referred Conversion
- Repeat Purchases
Each stage should have its own conversion rate to identify bottlenecks.
Future Trends in Referral Marketing Measurement
Referral analytics is evolving with AI, privacy laws, and omnichannel marketing.
1. AI-Powered Attribution
Machine learning models predict referral influence across complex journeys.
2. Privacy-First Tracking
Cookieless tracking and first-party data will dominate referral measurement strategies.
3. Community-Based Referrals
Tracking referrals from communities, influencers, and ambassadors will become more critical.
4. Web3 and Loyalty Tokens
Blockchain-based referral rewards and decentralized loyalty systems are emerging.
Referral Marketing Metrics by Business Model
Referral metrics differ across industries. Tailoring measurement frameworks by business model improves decision-making.
1. E-commerce Referral Metrics
- Average Order Value (AOV) of referred customers
- Repeat purchase rate
- Referral-driven cart conversion rate
- Product-level referral attribution
2. SaaS Referral Metrics
- Trial-to-paid referral conversion rate
- Expansion revenue from referred users
- Product adoption metrics (DAU/MAU, feature usage)
- Churn rate of referred accounts
3. B2B Referral Metrics
- Referral-to-lead conversion rate
- Sales cycle length for referred leads
- Deal size of referred accounts
- Pipeline contribution from referrals
Financial Modeling for Referral Programs
Understanding financial impact ensures referral programs scale sustainably.
Referral Unit Economics
Track:
- Reward cost per referral
- Gross margin from referred customers
- Payback period
- Contribution margin after rewards
Referral Marketing Cohort Analysis
Cohort analysis reveals how referral customers behave over time.
Track cohorts by:
- Referral month
- Referrer segment (VIP vs regular customers)
- Incentive type
- Acquisition channel of referrer
Compare retention, revenue, and churn across cohorts to identify the highest-value referral segments.
Segmentation Metrics for Referral Optimization
Not all referrers are equal. Segment to scale the best advocates.
Top Referrer Segments
- Power users and loyal customers
- Influencers and creators
- Enterprise customers
- Community leaders
Key Segment Metrics
- Referrals per user
- Conversion rate per segment
- Revenue per referrer
- Engagement frequency
Reward Strategy Metrics
Incentives drive referral behavior—measure their effectiveness.
Reward Redemption Rate
Indicates how compelling your incentive is.
Reward Cost Efficiency
Revenue generated per reward dollar spent.
Double-Sided vs Single-Sided Incentive Performance
Compare programs rewarding both referrer and referred vs only the referrer.
Referral Program UX Metrics
User experience strongly affects participation and conversion.
Track:
- Referral link click-through rate
- Program page bounce rate
- Referral sharing friction (steps to share)
- Drop-off rate in referral signup flow
Optimize UX to reduce friction and boost participation.
Competitive Benchmarking Metrics
Compare referral program performance against competitors.
Benchmark KPIs
- Referral share of total acquisition
- Referral participation rate
- Incentive value vs industry average
- Viral coefficient vs industry benchmark
This helps justify investments and differentiate your program.
Data Governance & Compliance Metrics
Privacy laws affect referral tracking and attribution.
Key Compliance Metrics
- Consent rate for referral tracking
- Data retention compliance score
- GDPR/CCPA opt-out impact on referral tracking
Monitoring compliance prevents legal and reputational risk.
Growth Flywheel Metrics
Referral marketing fuels a compounding growth loop.
Flywheel Metrics
- Advocacy rate → Referral rate → Conversion rate → Retention → Repeat referrals
- Time to advocacy (how long before customers start referring)
- Advocacy lifetime value
These metrics reveal how fast your growth engine compounds.
AI and Predictive Referral Analytics
Modern teams use AI to forecast referral growth.
Predictive Metrics
- Predicted referral propensity score
- Likely super-referrer identification
- Forecasted referral revenue
- Churn prediction for referred customers
Referral Marketing Reporting Framework
Create a structured reporting cadence.
Weekly
- Referral traffic and conversions
- Sharing activity
Monthly
- Participation rate
- Viral coefficient
- CPRA
Quarterly
- CLV comparisons
- Referral revenue share
- ROI and profitability
Actionable Referral Metric Optimization Playbook
Turn insights into growth.
If the conversion rate is low
- Improve landing page UX
- Personalize referral messaging
- Strengthen social proof
If the Participation Rate Is Low
- Increase incentives
- Promote referral program in lifecycle emails
- Add in-app referral prompts
If CPRA Is High
- Reduce rewards
- Focus on high-value referrer segments
- Improve conversion funnel efficiency
Advanced Metrics for Referral Program Optimization
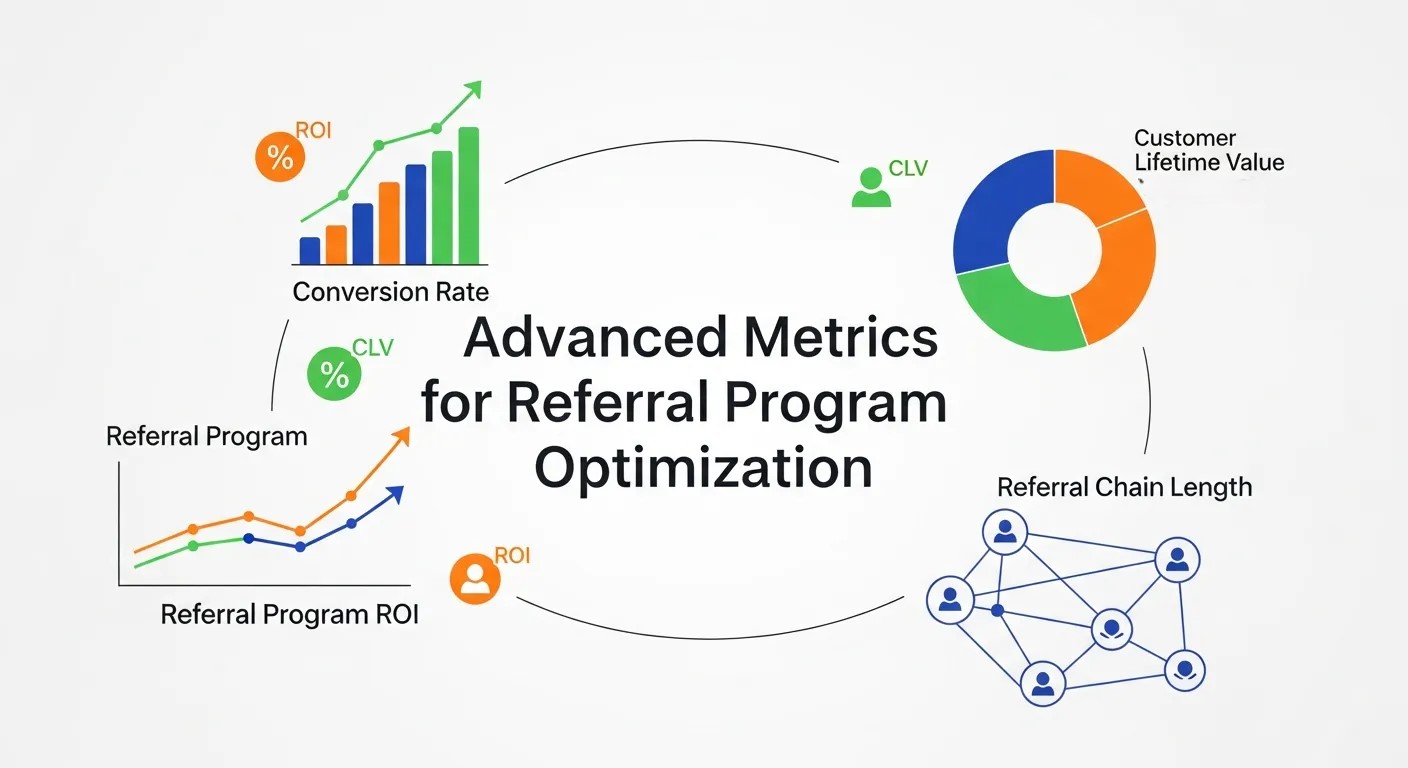
Viral Coefficient
The viral coefficient measures how many new customers each existing customer generates through referrals. A viral coefficient above 1.0 indicates exponential growth potential—each customer brings in more than one new customer on average.
Calculate the viral coefficient by multiplying the average number of referrals per customer by the referral conversion rate. Most successful programs achieve viral coefficients between 0.5 and 0.8, with exceptional programs reaching 1.0 or higher.
Referral Revenue Attribution
Understanding how referral revenue contributes to overall business growth provides crucial context for program investment decisions. Track both direct referral revenue and influenced revenue from customers who later make additional purchases.
Many businesses find that referral programs generate 20% to 30% of their total revenue once fully optimized. This metric helps quantify program ROI and justify resource allocation.
Time to Referral Conversion
This metric measures the average time between when a referral link is shared and when the referred customer converts. Shorter conversion times typically indicate higher program effectiveness and better audience targeting.
Fast conversion times suggest strong referral motivation and clear value communication. Extended conversion periods might indicate complex decision-making processes or insufficient follow-up mechanisms.
Behavioral Metrics That Reveal Program Health
Sharing Frequency and Channels
Analyzing how often customers share referral links and which channels they prefer provides insights into program usability and audience behavior. Track sharing across email, social media, direct messaging, and other channels.
Social media sharing often generates broader reach but lower conversion rates. Email and direct messaging typically produce higher conversion rates but limited reach. Understanding these patterns helps optimize sharing experiences.
Referral Source Performance
Different referral sources produce varying results. Customers acquired through different channels may have different referral behaviors and success rates. Track performance by original acquisition source to identify your most valuable referrer segments.
Organic customers often make the best referrers, generating higher-quality referrals with better conversion rates. Paid acquisition customers might refer less frequently but still contribute meaningful program volume.
Engagement Depth
Measure how deeply customers engage with your referral program beyond initial signup. Track metrics like referral link clicks, program page visits, and reward redemption rates.
High engagement depth indicates strong program stickiness and customer satisfaction. Low engagement might signal poor user experience or insufficient ongoing communication.
Technology and Attribution Considerations
Multi-Touch Attribution
Modern customer journeys involve multiple touchpoints before conversion. Implement multi-touch attribution models that credit referrals appropriately when they contribute to conversions alongside other marketing channels.
First-touch attribution gives full credit to referrals that initiate customer relationships. Last-touch attribution credits referrals that directly drive conversions. Time-decay models distribute credit across multiple touchpoints based on proximity to conversion.
Mobile vs. Desktop Performance
Referral sharing behavior differs significantly between mobile and desktop users. Mobile users share more frequently but may have different conversion patterns. Track performance across devices to optimize experiences accordingly.
Mobile referral links should be optimized for app-to-app sharing and social media platforms. Desktop experiences can accommodate more detailed information and complex sharing options.
Setting Benchmarks and Goals
Industry-Specific Benchmarks
Referral program performance varies significantly across industries. E-commerce businesses might see different participation rates than SaaS companies or service providers. Research industry-specific benchmarks to set realistic expectations.
B2C companies typically achieve higher participation rates but may have lower individual referral values. B2B businesses often see lower participation but higher-value referrals with longer sales cycles.
Seasonal and Cyclical Patterns
Referral activity often follows seasonal patterns aligned with your business cycles. Holiday seasons, back-to-school periods, and industry-specific events can dramatically impact program performance.
Plan for these fluctuations by adjusting promotional strategies and reward structures. Capitalize on high-activity periods while maintaining engagement during slower times.
Turning Metrics Into Actionable Insights
Regular Performance Reviews
Establish monthly or quarterly referral program reviews that examine key metrics alongside business objectives. Look for trends, identify bottlenecks, and celebrate successes.
Create dashboard reports that track essential metrics over time. Visual representations help stakeholders understand program performance and support optimization decisions.
Testing and Optimization
Use metric insights to guide systematic testing of program elements. Test different reward structures, sharing mechanisms, and promotional strategies based on performance data.
A/B testing referral incentives can reveal optimal reward levels that maximize participation without overspending. Test sharing copy, timing, and channels to improve conversion rates.
Integration with Business Strategy
Align referral metrics with broader business objectives. If customer acquisition is your primary goal, focus on metrics that drive volume. If profitability matters most, emphasize CLV and CPRA optimization.
Communicate referral program performance in terms that resonate with executive stakeholders. Translate metrics into revenue impact, cost savings, and competitive advantages.
Maximizing Your Referral Program’s Potential
Measuring referral marketing success requires a balanced approach that combines volume metrics with quality indicators. The most successful programs track both immediate results and long-term customer value while maintaining focus on cost efficiency and program sustainability.
Start by implementing the core metrics outlined above, then gradually expand your measurement capabilities as your program matures. Remember that referral marketing is a long-term strategy—consistent optimization based on solid metrics will compound your results over time.
The craze era demands precision in measurement and agility in optimization. By tracking the right metrics and acting on the insights they provide, you’ll build a referral program that not only survives but thrives in this competitive landscape.
Conclusion
Referral marketing metrics turn advocacy into a predictable growth engine. By tracking conversion rates, CLV, participation, viral coefficient, and CPRA, teams can prove ROI, optimize incentives, and scale profitable acquisition. Layering behavioral, cohort, and attribution data reveals where friction exists and which advocates drive the most value. Align dashboards with executive KPIs, test continuously, and adapt to privacy-first analytics. When referral marketing is measured holistically, it compounds trust, revenue, and retention—transforming customers into a sustainable acquisition channel. Start with core KPIs, expand to advanced models, and use insights to personalize rewards and messaging for faster, scalable, and profitable growth today.
FAQ: Referral Marketing
1. What is referral marketing?
Answer:
Referral marketing is a strategy where businesses encourage existing customers to recommend products or services to others, often using incentives like discounts or rewards. It leverages word-of-mouth to drive high-trust customer acquisition.
2. Why is referral marketing important for businesses?
Answer:
Referral marketing builds trust, reduces acquisition costs, and increases customer lifetime value. Referred customers often convert faster, spend more, and stay loyal longer than other acquisition channels.
3. How does referral marketing work?
Answer:
Referral marketing works by giving customers a referral link or code to share with friends. When someone signs up or purchases using that referral, both the referrer and the referred user may receive rewards.
4. What are the key referral marketing metrics to track?
Answer:
Key referral marketing metrics include referral conversion rate, participation rate, viral coefficient, customer lifetime value (CLV), cost per referral acquisition (CPRA), and referral revenue contribution.
5. What is a good referral conversion rate?
Answer:
A good referral conversion rate typically ranges from 3% to 15%, depending on industry, product complexity, and incentive structure. SaaS and B2B often have lower rates but higher deal value.
6. How do referral programs increase customer lifetime value?
Answer:
Referral marketing attracts highly trusted customers who tend to repeat purchases, churn less, and engage more with the brand, leading to higher lifetime value compared to paid acquisition channels.
7. What incentives work best in referral marketing?
Answer:
Common incentives include cash rewards, discounts, store credits, free products, subscriptions, and exclusive perks. Double-sided incentives (rewarding both referrer and referred) usually perform best.
8. What is the viral coefficient in referral marketing?
Answer:
The viral coefficient measures how many new customers each existing customer brings in. A viral coefficient above 1 means referral marketing can grow exponentially without additional marketing spend.
9. How can businesses prevent referral fraud?
Answer:
Businesses can prevent fraud by monitoring duplicate accounts, IP addresses, unusual reward redemptions, and using referral software with built-in fraud detection systems.
10. How can companies optimize referral marketing performance?
Answer:
Companies can optimize referral marketing by improving incentives, simplifying sharing, personalizing referral messages, tracking funnel metrics, running A/B tests, and aligning referral programs with retention and loyalty strategies.
Learn more about: How to Promote Your Business Effectively


